Target
Halve the gap for Indigenous children in reading, writing and numeracy within a decade (by 2018)
Key points
- At the national level, the share of Indigenous students at or above national minimum standards in reading and numeracy has improved over the past decade to 2018. The gap has narrowed across all year levels by between 3 and 11 percentage points.
- Despite these improvements, in 2018 about one in four Indigenous students in Years 5, 7 and 9, and one in five in Year 3, remained below national minimum standards in reading. Between 17 to 19 per cent of Indigenous students were below the national minimum standards in numeracy.
- Looking at students exceeding national minimum standards provides a better understanding of how well Indigenous children are placed to successfully transition to further study or work. Between 2008 and 2018, for example, the share of Year 3 students exceeding the national minimum standard in reading increased by around 20 percentage points.
What the data tells us
National
The target to halve the gap in the share of Indigenous children at or above national minimum standards in reading and numeracy within the decade (by 2018) was not met.1,2 National minimum standards represent a performance standard below which students have difficulty progressing at school (ACARA 2016a).
Successfully progressing through and transitioning from school is important for children to improve social mobility and intergenerational outcomes. Education has a strong association with employability and income, health, and control over one’s life (Pagnini et al. 2014; World Bank 2018). Better education outcomes can also have positive intergenerational flow-on effects. More educated mothers, for example, have been associated with healthier children (Ewald and Boughton 2002; Schochet et al. 2020).
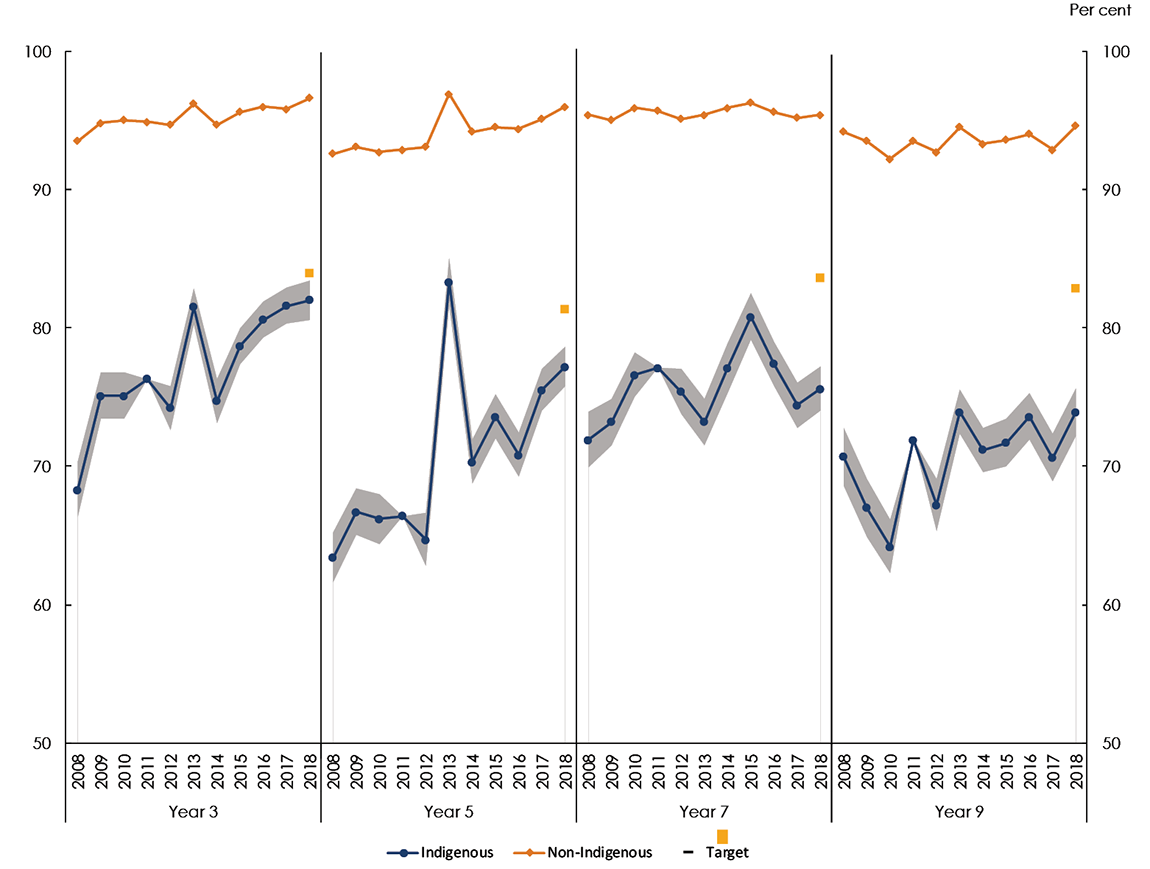
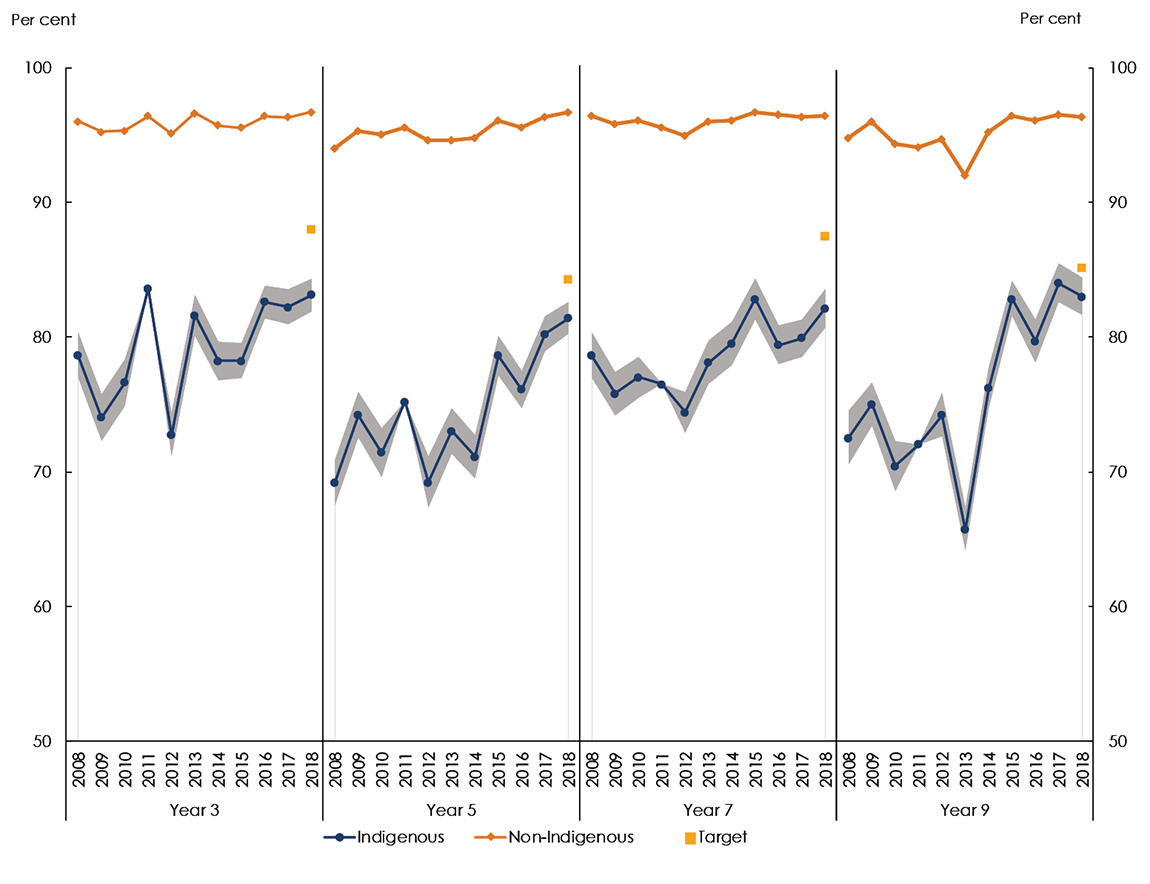
At the national level, the share of Indigenous students at or above national minimum standards in reading and numeracy has improved over the past decade and the gap has narrowed (Figure 4.1 and Figure 4.2).
Between 2008 and 2018, for students in Years 3, 5, 7 and 9:
- the share of Indigenous students at or above national minimum standards increased by 3 to 14 percentage points in reading, and by 4 to 12 percentage points in numeracy.3
- the gap in reading and numeracy outcomes narrowed by between 3 and 11 percentage points. The largest improvement in the gap was for Years 3 and 5 reading (11 and 10 percentage points respectively), and Year 5 and Year 9 numeracy (10 and 9 percentage points respectively).4
Despite these improvements, in 2018 about one in four Indigenous children in Years 5, 7 and 9, and one in five in Year 3, remained below national minimum standards in reading (Figure 4.1). Between 17 to 19 per cent of Indigenous students were below national minimum standards in numeracy (Figure 4.2).
Source: Australian Curriculum, Assessment and Reporting Authority, 2019, unpublished.
Note:
- Shaded areas represent the 95 per cent confidence interval in school results for Indigenous Australians. Confidence intervals reflect the level of uncertainty associated with the measurement of results. They define a range of values within which the actual result is likely to lie.
View the text alternative for Figure 4.1.
Source: Australian Curriculum, Assessment and Reporting Authority, 2019, unpublished.
Note:
- Shaded areas represent the 95 per cent confidence interval in school results for Indigenous Australians. Confidence intervals reflect the level of uncertainty associated with the measurement of results. They define a range of values within which the actual result is likely to lie.
View the text alternative for Figure 4.2.
States and Territories
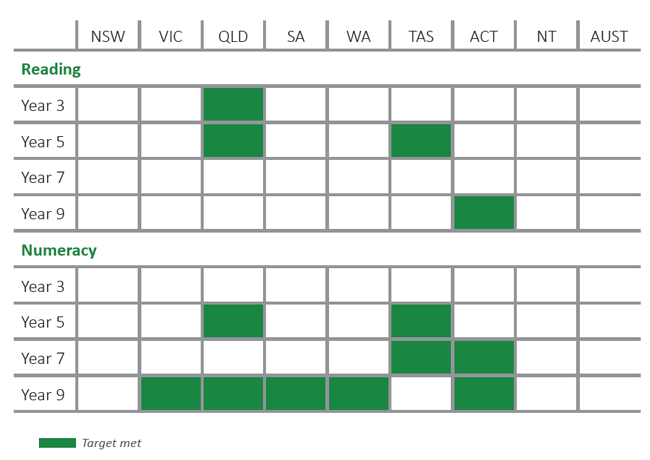
At the jurisdictional level, the target to halve the gap in reading and numeracy outcomes was assessed across 64 result areas.5 The target was met in 13 of these result areas (Table 4.1).6
For Year 9 numeracy outcomes, five jurisdictions met the target over the decade to 2018. This result was largely driven by improvements over the decade in outcomes for Indigenous students living in Major Cities and regional areas.7
Source: Australian Curriculum, Assessment and Reporting Authority, 2019, unpublished.
View the text alternative for Table 4.1.
Geographic analysis
School performance is associated with a range of health, family and community level factors. The incidence of hearing impairments, for example, is higher for Indigenous children living in remote Australia relative to Indigenous children living in non-remote areas (AHMAC 2017). Studies have linked health issues, such as hearing loss, with lower school attendance (Su et al. 2019) and lower educational attainment (Conti et al. 2010).
As the factors contributing to schooling performance vary across Australia, geographic level analysis can provide greater insight into student NAPLAN outcomes. Year 3 results broken down by remoteness and jurisdiction, for example, provide a better understanding of outcomes for students early in their schooling than national figures. Year 3 is the first year that children sit for the NAPLAN, and is more closely associated with the time during a child’s schooling when measures affecting development are likely to be most effective (Heckman 2008).
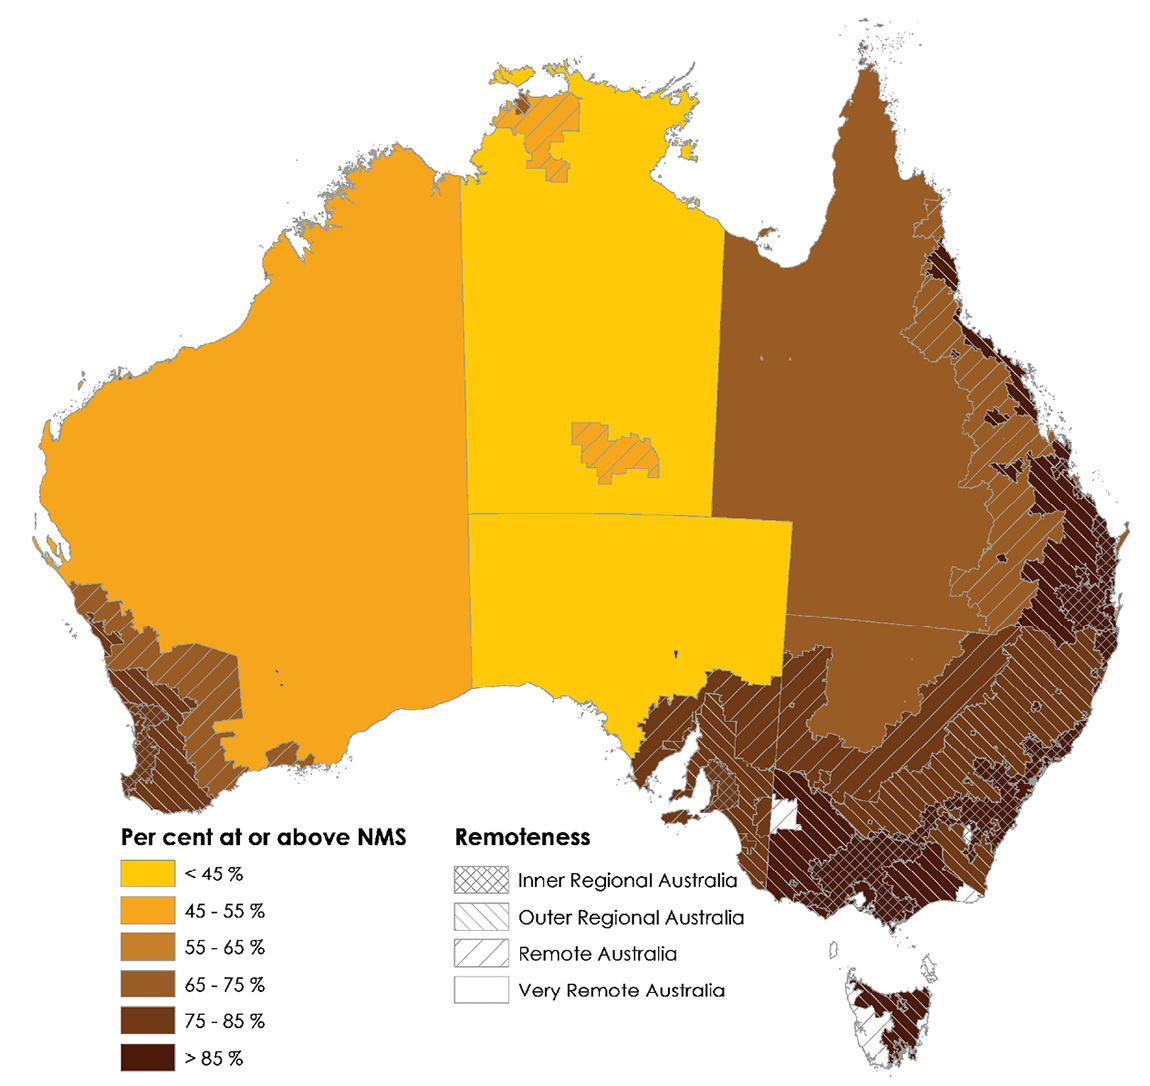
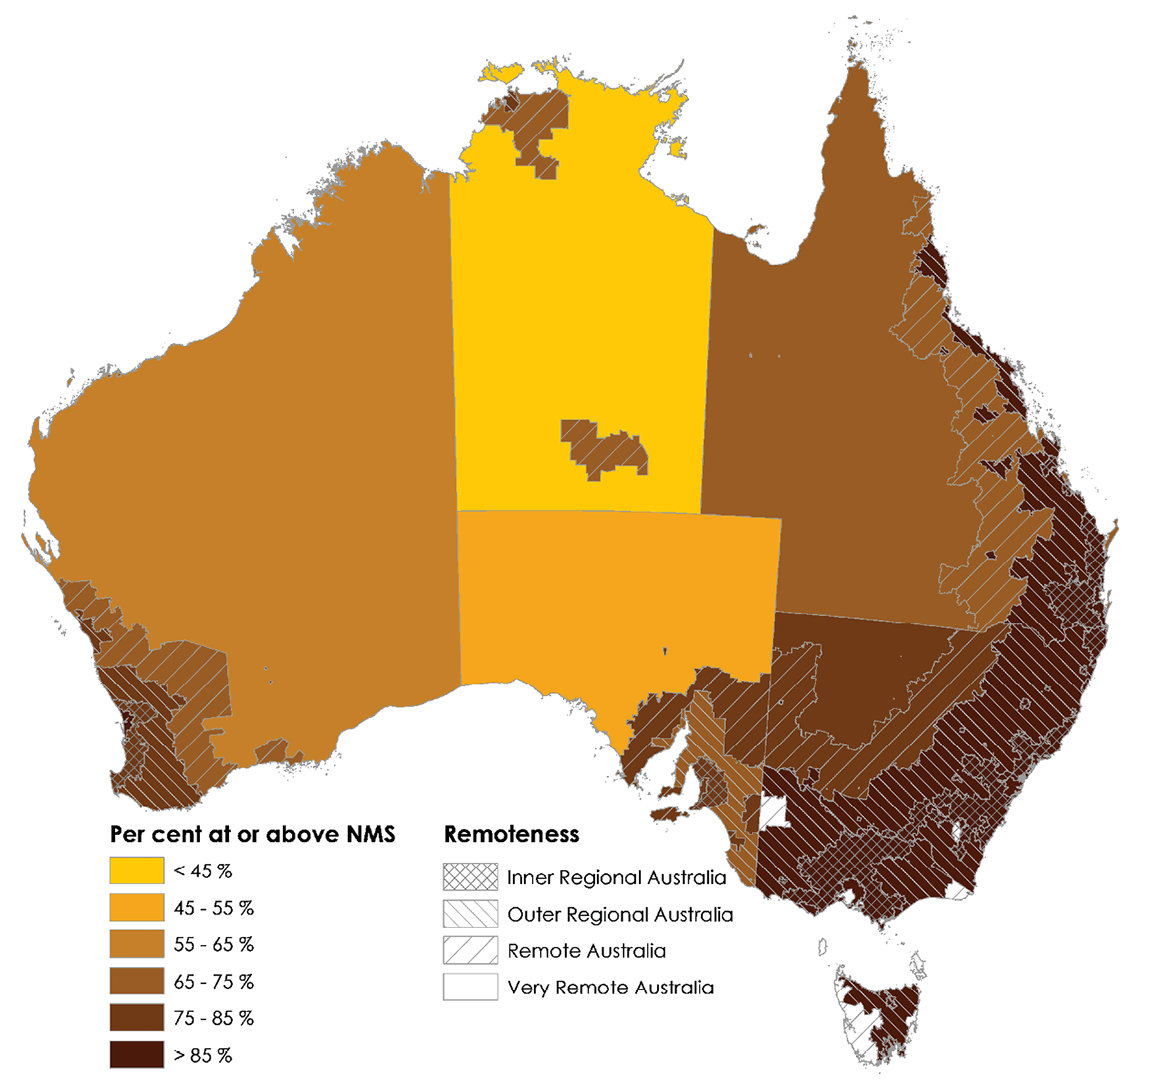
Nine in ten (around 89 per cent) Indigenous Year 3 students living in Major Cities met or were above national minimum standards in reading and numeracy in 2018. Outside Major Cities, there was considerable variation in Year 3 reading and numeracy outcomes (Figure 4.3 and Figure 4.4). The same variation in Remote and Very Remote areas is not observed in Year 3 outcomes for non‑Indigenous students.
Source: Australian Curriculum, Assessment and Reporting Authority, 2019, unpublished.
Notes:
- For the Australian Capital Territory as well as some areas in Tasmania and Victoria, results cannot be published due to low numbers of Indigenous students or schools.
- The map provides an indication of the variation in reading outcomes across Australia. Confidence intervals—that is, the level of uncertainty associated with the measurement of results—within a remoteness area and jurisdiction are not reported.
View the text alternative for Figure 4.3.
Source: Australian Curriculum, Assessment and Reporting Authority, 2019, unpublished.
Notes:
- For the Australian Capital Territory as well as some areas in Tasmania and Victoria, results cannot be published due to low numbers of Indigenous students or schools.
- The map provides an indication of the variation in numeracy outcomes across Australia. Confidence intervals—that is, the level of uncertainty associated with the measurement of results—within a remoteness area and jurisdiction are not reported.
View the text alternative for Figure 4.4.
Reading and numeracy outcomes were relatively low for Year 3 Indigenous students living in Remote and Very Remote areas. These areas of Australia also recorded the lowest levels of primary school attendance in 2019 (Figure 3.4).
However, as with school attendance, there was considerable variation in outcomes for students living in remote Australia.
Eight in ten (around 80 per cent) Indigenous Year 3 students in Remote and Very Remote New South Wales, for example, were above the national minimum standard in numeracy in 2018. Remote New South Wales also had relatively high rates of primary school attendance in 2019 (Figure 3.5). In comparison, in 2018, the share of Year 3 students at or above national minimum standard in numeracy in Very Remote Northern Territory and Very Remote South Australia was around 37 per cent and 53 per cent respectively.
Participation in NAPLAN is lower for Indigenous students in remote Australia. In 2018, participation by Indigenous students ranged from around 90 per cent for Years 3 and 5 in Major Cities and regional areas, to 49 per cent for Year 9 students in Very Remote areas. Low participation can skew the measurement of results, as students who were absent or withdrawn from NAPLAN are more likely to have relatively poor reading and numeracy outcomes (COAG Reform Council 2012, Thompson 2013).
School achievement across the distribution
Successfully progressing through school is important for students’ transition to further study or work. There is some evidence that Indigenous and non‑Indigenous students who reach the same level of academic achievement by age 15 (as measured by the Programme for International Student Assessment) have similar Year 12 completion rates and participation rates in university and vocational training (Mahuteau et al. 2015).
The six reported NAPLAN achievement bands provide a measure of the distribution of student outcomes (ACARA 2016b). As noted earlier, students achieving below national minimum standard—the first NAPLAN band—may have difficulty progressing at school. Students meeting national minimum standards are at the second achievement band, and those exceeding national minimum standards are in the third or higher bands.
A large share (close to 65 per cent) of Indigenous Year 3 students were exceeding the national minimum standard in reading in 2018 (band 3 or higher) (Figure 4.5). As noted above, Year 3 is the first year children sit NAPLAN, and is more closely associated with the time during a child’s schooling when measures affecting development are likely to be most effective (Heckman 2008).
Achievement in reading (and numeracy) was skewed towards the middle bands (Figure 4.5). In 2018, one in five Indigenous Year 3 students achieved in the top two bands for reading (band 5 and 6). In comparison, more than half (around 56 per cent) of Year 3 non-Indigenous students achieved in the top two bands for reading (band 5 and 6).
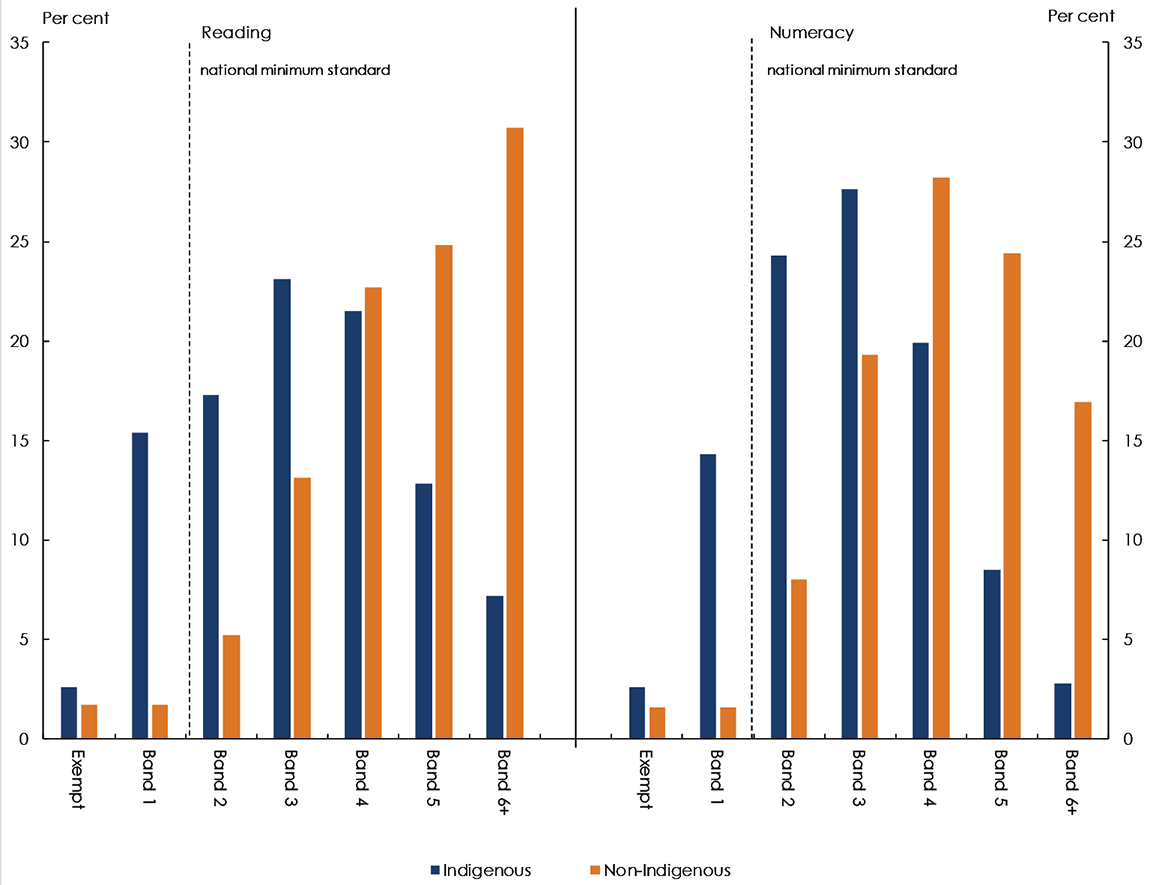
Source: Australian Curriculum, Assessment and Reporting Authority, 2019, unpublished.
Notes:
- Exempt status applies to students with a significant disability or from a non-English speaking background.
- Confidence intervals for the results by band are not published by ACARA.
View the text alternative for Figure 4.5.
Over the past decade to 2018, schooling achievement for Year 3 Indigenous students in reading and numeracy has improved across the distribution (Figure 4.6). In reading, the share of Indigenous Year 3 students exceeding the national minimum standard (bands 3 or higher) increased by around 20 percentage points, while the share of Indigenous Year 3 students in the top two bands increased by just over 8 percentage points8.
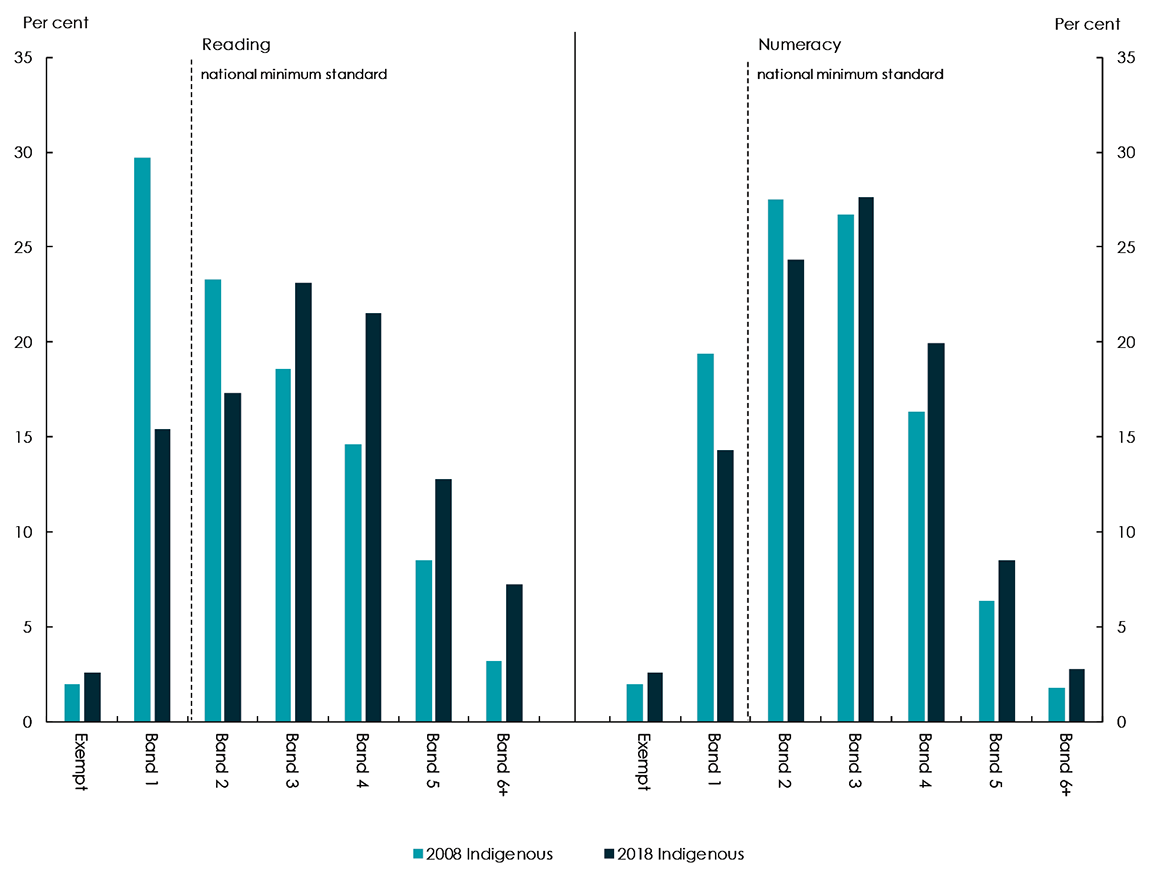
Australian Curriculum, Assessment and Reporting Authority, 2019, unpublished.
Notes:
- Exempt status applies to students with a significant disability or from a non-English speaking background.
- Confidence intervals for the results by band are not published by ACARA.
View the text alternative for Figure 4.6.
A similar pattern of improvement across the distribution of numeracy scores occurred over the decade to 2018 for Year 3 Indigenous students. The share of Indigenous Year 3 students exceeding the national minimum standard (bands 3 or higher) in numeracy increased by just under 8 percentage points, while the share of Indigenous Year 3 students in the top two bands increased by around 3 percentage points.
[1] Schooling outcomes from the 2019 National Assessment Program – Literacy and Numeracy (NAPLAN) were not available for inclusion in this report.
[2] The target as originally agreed in 2008 also included writing results. However, due to a change in the test from narrative to persuasive writing, the writing results from 2011 onwards cannot be directly compared to the results from previous years, and so have been excluded.
[3] Between 2008 and 2018, the increase in the share of Indigenous students at or above national minimum standards in reading were not statistically significant for Years 7 and 9.
[4] Statistical significance of the changes in the gap between 2008 and 2018 were not available.
[5] The 64 result areas cover each of the eight jurisdictions’ results measured across the four year levels (Years 3, 5, 7 and 9) for both reading and numeracy NAPLAN outcomes.
[6] As noted above, the statistical significance of the changes in the gap were not available.
[7] Across these five jurisdictions, improvements in NAPLAN outcomes for Indigenous students in Major Cities and Regional areas were statistically significant. Improvements in Year 9 numeracy outcomes for Indigenous students living in Remote and Very Remote areas of these five jurisdictions were not statistically significant.
[8] The statistical significance of the changes in the NAPLAN band proportions were not available.